
Creating a network diagram is essential for visualizing your network architecture and ensuring compliance. This guide will walk you through the process of creating a network diagram to help segregate your customer data and infrastructure environments. A well-crafted diagram provides evidence of security measures and network segregation, which is crucial during compliance audits.
What is a Network Diagram?
A network diagram is a visual representation of your network’s architecture. It illustrates the systems and components on your network, where they reside, and how they interact with each other. It is vital for compliance, as it shows auditors how production and development environments are separated.
Key Elements of a Network Diagram:
- Environments: Include both development and production environments and highlight segregation.
- Connection Points: Identify assets where sensitive information is transmitted, processed, or stored.
- Touch Points: Show systems where sensitive data is transmitted but not stored or processed.
- Boundaries: Define boundaries between trusted and untrusted networks.
- Network Protections: Display security measures surrounding sensitive systems.
- System Components: Include elements such as databases, routers, firewalls, and application servers.
Components in a Network Diagram
When creating a network diagram, use colors and shapes to distinguish between systems and components. Here’s what to include:
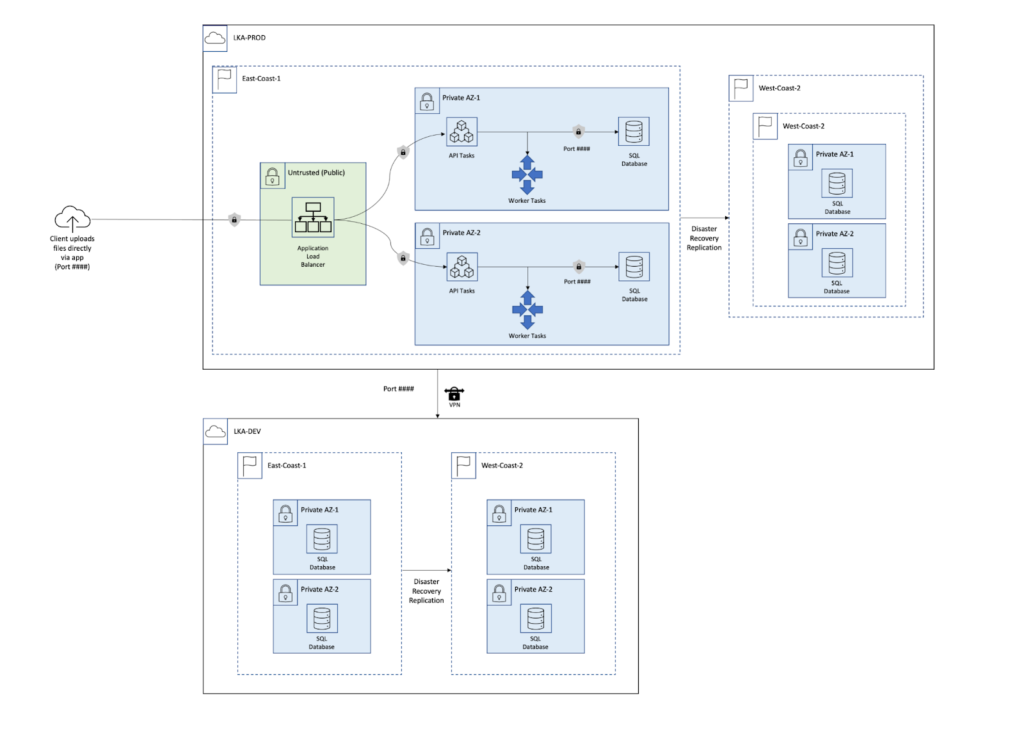
- Green Box: Represents untrusted public networks, such as where load balancers reside.
- Blue Boxes: Represent subsystems processing information from untrusted networks.
- Connecting Lines: Show the interaction between systems.
- Arrows: Indicate the direction of data flow.
- Solid and Dashed Lines: Highlight the segregation between different environments and systems.
Sample Network Diagram:
Navigating Audits with a Network Diagram
A well-maintained network diagram demonstrates compliance by showing how development and production environments are segregated. Regularly review and update the diagram to keep it accurate and audit-ready. It’s essential to ensure the diagram is up-to-date before submitting it for any audit.
Best Practices for Creating a Network Diagram:
To ensure accuracy and compliance, follow these best practices:
- Identify In-Scope Systems: Begin by identifying all production systems and cloud resources that need to be diagrammed.
- Step-by-Step Approach:
- Diagram each production system individually.
- Visually group the systems based on how they reside in your environment.
- Show how systems communicate by connecting them with lines and arrows.
- Use Standard Icons and Labels:
- Use common symbols to depict assets and system components.
- Label all assets and components clearly.
- Show Boundaries and Segregation:
- Use shapes and colored lines to group systems within environments.
- Use different patterns to show the segregation between trusted and untrusted networks.
- Illustrate Data Flow:
- Use arrows to show the direction in which sensitive information flows—whether inbound, outbound, or bidirectional.
Tools for Creating Network Diagrams
Several online tools can help you create your network diagram, including:
- Lucidchart
- Google Architecture Diagramming
- AWS Architecture Diagram
These tools allow you to follow the best practices mentioned above and create clear, compliant diagrams.
By following these steps and maintaining your network diagram, you can ensure compliance, safeguard sensitive data, and have a clear visual document for auditors.
For more guidance, visit OmyaLabs for expert advice on IT compliance and security.
References:
- Omya Labs: https://omyalabs.com
- Lucidchart
- AWS Architecture Diagram


